At SIS, our BI team works with our specialty construction and project-based clients to create meaningful dashboards that are immersive. SIS also works with Microsoft Dynamics 365 users to extract data from D365 and create high value visual reports. Review our project dashboards below as you learn more about Power BI and what SIS has to offer.
Why Microsoft Power BI?
With Power BI users are able to experience their data. They make sense of their data easily and make quick confident decisions across the business. Users reduce the amount of time spent struggling to pull data together and spend more time with AI insights. Most importantly, Power BI removes the complexity of managing multiple analytics solutions with a single unified platform that gives every user access to insights.
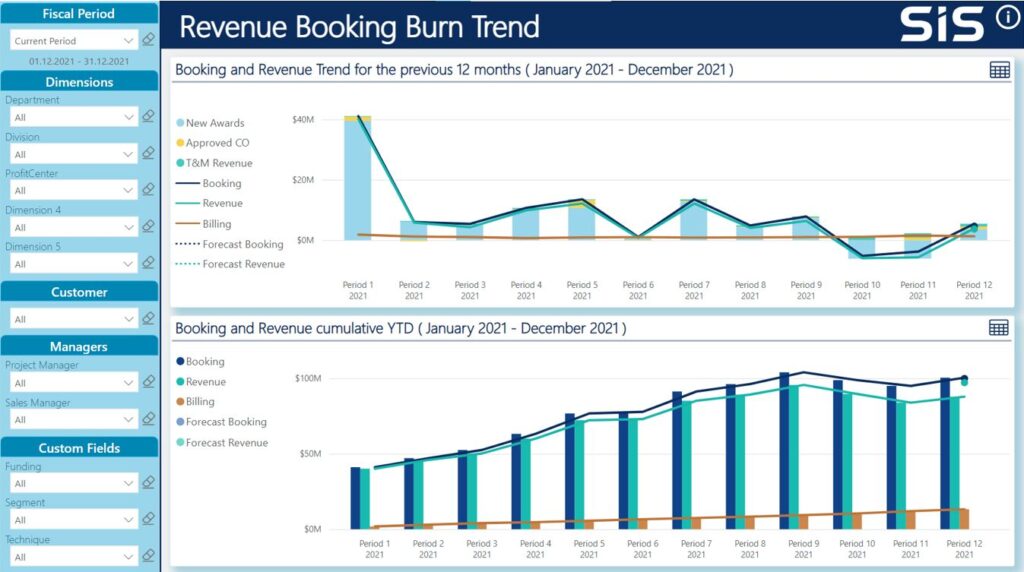
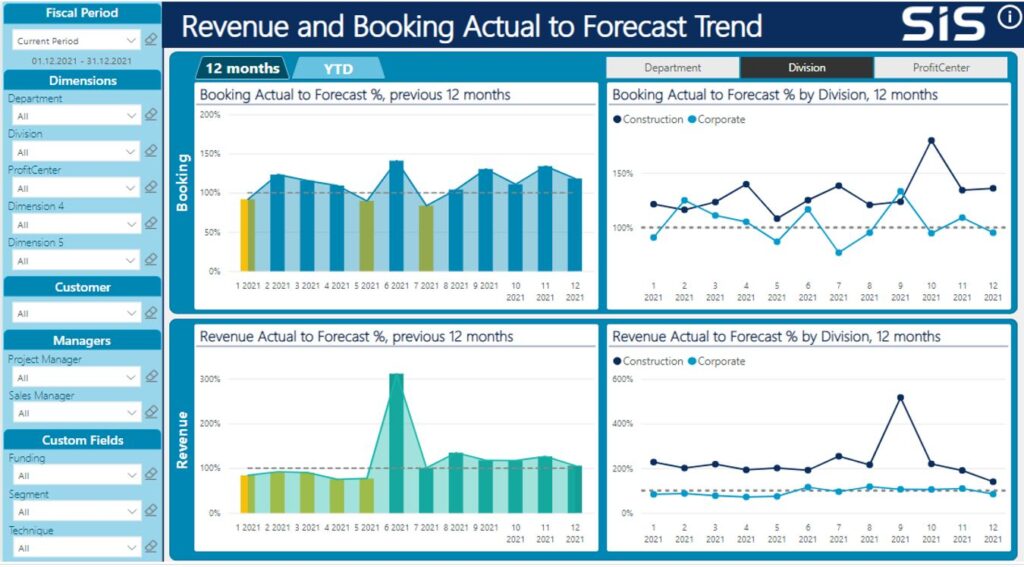
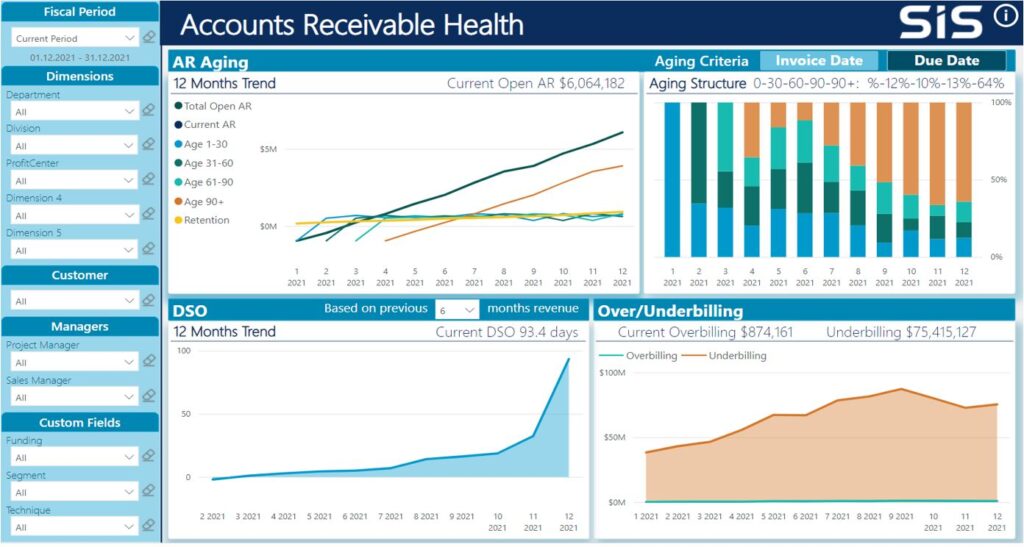
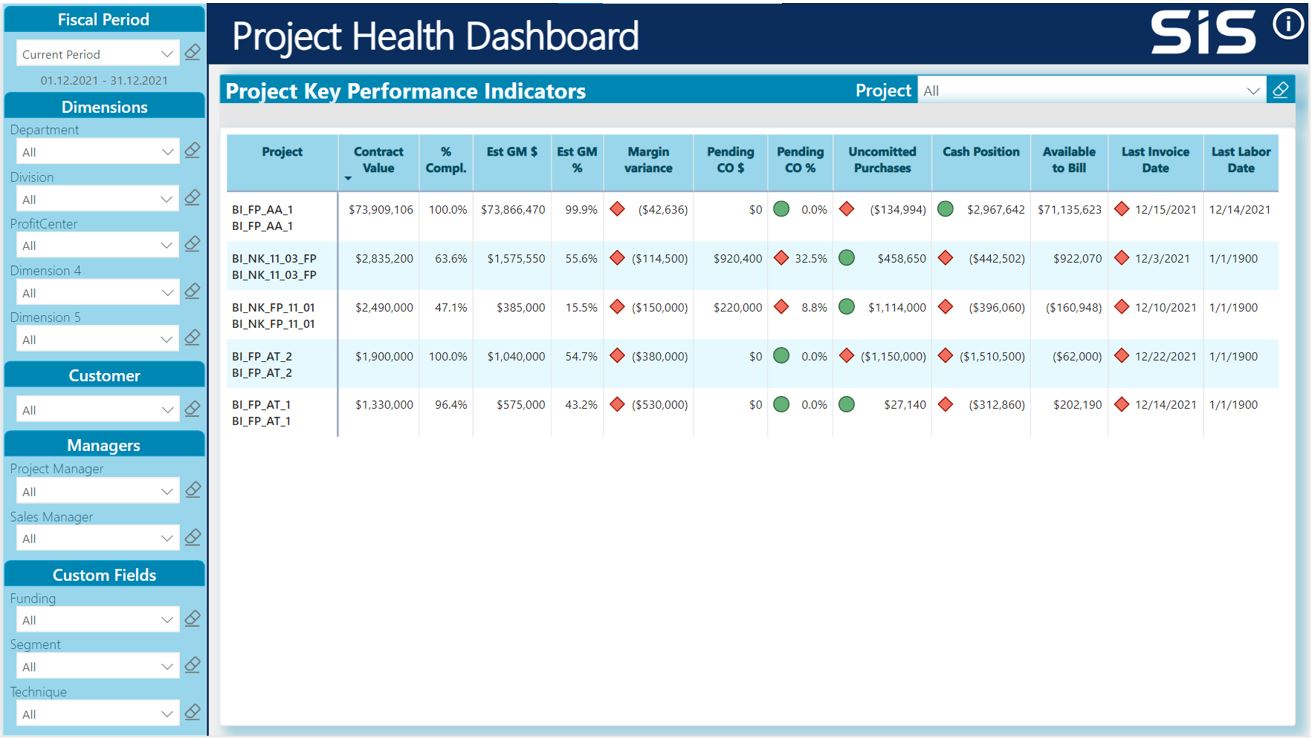
Out of the box report visualizations include Bar and Column Charts, Single or Multi Row Cards, KPIs, Maps, Pie Charts, Q&A Visual, and Tables. SIS can demonstrate a significant number of report visualizations similar to each production dashboard on this page. Each dashboard was created by SIS with Power BI using Microsoft Dynamics 365 Finance data along with the SIS Construct 365 Project Cost Management (PCM) Solution. Contact us for a full demonstration of the dashboarding process for businesses with professional service operations.
What is Power BI?
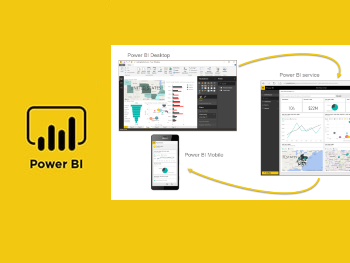
Power BI is a group of software services, apps, and connectors that work together to turn unrelated data sources into clear, visual insights. Data may be in Excel or cloud-based or on-premise hybrid data warehouses. Power BI enables users to connect to their data sources, visualize key intel, and share with anyone.
As a start, Power BI consists of:
Power BI Desktop Power BI Service Power BIMobile apps
Power BI Benefits
Pulls the business insights out of your company data sources
Dashboards provide executive decision support
Dashboards can put BI in everyone’s hands
Add Visual presentation to and Data you have
Dashboards are fully customizable
Can run on any device. Desktops, smart phones, and tablets
Can extract data from almost anywhere
Power BI and D365
Quickly Visualize data from Power Apps and Dynamics 365 Apps
Recently there is a new way for users to visualize model-driven Power Apps and Dynamics 365 data stored within Dataverse. In one click, Power BI automatically generates a set of visuals for users to explore and find insights within their data.
SIS BI Advisory:
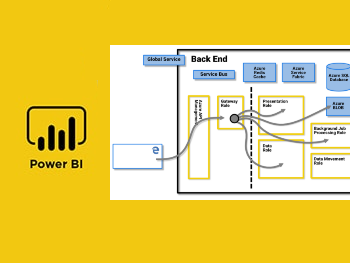
SIS works together with the client to set up and configure Azure and Power BI
SIS works with client to install back-end Azure services like Azure Data Lake
SIS works with client to transfer knowledge along the way
SIS can provide knowledge transfer for Dashboards and Reports
Benefits:
Hands on experience with D365 data and Power BI reporting
Fully running modern analytics platform
Client will have in house knowledge
Client will be able to continue the analytics journey
Resources
Video
What is Power BI?
Power BI enables anyone to visualize and analyze data with greater speed, efficiency, and understanding.